
Between summer 2025 and spring 2026, the typical Slovenian grocery SKU rose 9% on the shelf. That's the median change across roughly 8,000 paired products. The headline hides a fan: rice is up 25%, dishwashing detergent 25%, coffee 12%, bread only 6%, shampoo hasn't moved at all, and toys are down 12%. Slovenian inflation isn't a line. It is a mosaic.
What the data shows
We paired 8,168 Slovenian grocery SKUs that had at least one recorded shelf price in each of two windows: June–August 2025 (the before) and February–April 2026 (the after). For each SKU we computed the median price in each window and the percent change. Aggregated by category:
| Category | Median change | Paired SKUs |
|---|---|---|
| Rice | +25.1% | 39 |
| Dishwashing detergent | +25.0% | 97 |
| Pet treats | +17.8% | 35 |
| Cleaning tools | +17.7% | 60 |
| Softener | +16.8% | 68 |
| Household cleaners | +16.0% | 291 |
| Pet food | +12.7% | 172 |
| Meat | +12.3% | 240 |
| Coffee | +12.1% | 174 |
| Chocolate | +11.6% | 206 |
| Yoghurt | +11.2% | 154 |
| Milk | +7.2% | 108 |
| Bread | +6.0% | 60 |
| Laundry detergent | +4.3% | 138 |
| Hair care | 0.0% | 429 |
| Cosmetics | 0.0% | 218 |
| Skincare | 0.0% | 292 |
| Toys | −11.7% | 39 |
| Writing & drawing | −15.0% | 89 |
| Household tools | −15.1% | 36 |
Inflation clusters into three bands. Commodity-pressure food — rice, meat, coffee, pet food — rose 11–25%. The cleaning aisle moved faster: dishwashing, softeners, cleaning tools and household cleaners all 16–25%, the year's quiet outperformer. Personal care didn't move at all. And three non-food aisles — toys, writing, hand tools — actually fell double digits.
The two most symbolically watched staples, bread and milk, held back at 6–7% — little more than half the basket-wide pace. A household that over-indexes on bread, milk and shampoo barely experienced inflation. A household that over-indexes on rice, meat and cleaning supplies saw close to double the headline.
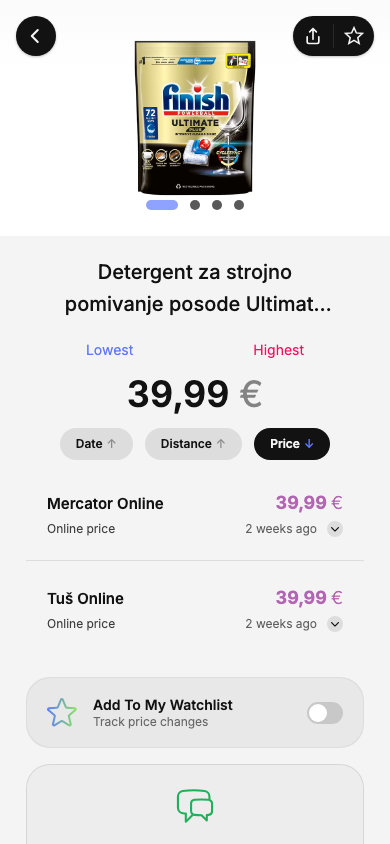
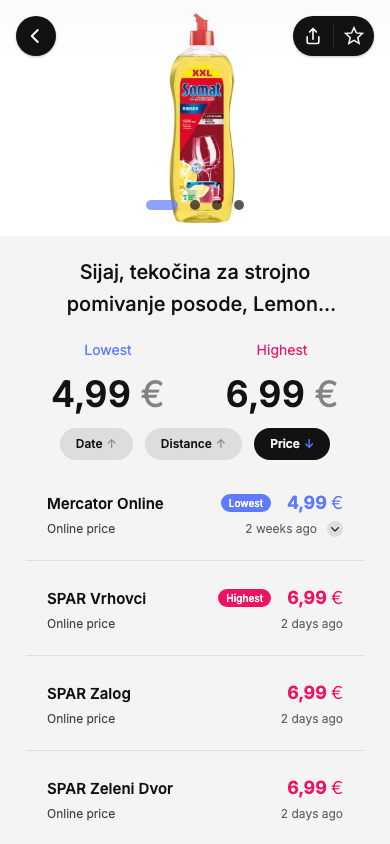
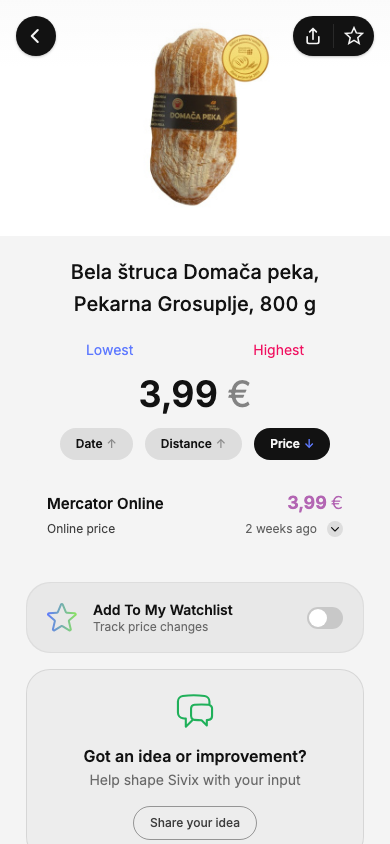
Concrete examples that make the bands tangible: a 72-tablet pack of Finish dishwasher tablets went from €21.99 to €39.99 (+82%). A 750 ml bottle of Somat rinse aid doubled, €3.50 to €6.99. An 800 g loaf of Pekarna Grosuplje white bread rose €3.59 to €3.99 (+11%). A garlic-butter Meggle baguette went €1.65 to €1.95.
Same SKU, ten months apart — % change
| Product | Change (%) |
|---|---|
| Somat Lemon rinse aid 750 ml | 100 |
| Finish Ultimate Plus 72 tablets | 82 |
| Meggle garlic baguette 160 g | 18 |
| Pekarna Grosuplje white loaf 800 g | 11 |
Source: Sivix, Slovenia, Jun–Aug 2025 vs Feb–Apr 2026
Why this happens
Slovenian grocery retail is consolidated around Mercator, Spar, Hofer (Aldi) and Lidl. Each category has a different competitive logic. Bread and milk are loss-leaders: their visible low prices draw shoppers into the store, so chains hold the line there and recover margin elsewhere. Political and media scrutiny reinforces this — a rise in chocolate doesn't make the news, a rise in bread becomes a news cycle.
The aisles that rose hardest — cleaning supplies, rice, dessert, pastry — share a profile: purchased less often, compared less carefully, and manufactured from inputs (oil, grain, soda ash) that genuinely rose on commodity markets. Shoppers notice bread because they buy it weekly. They don't notice that their dishwasher tablets went up 80% because they buy them once a quarter.
The deflating aisles — toys, writing supplies, hand tools — aren't weekly essentials. They cycle on clearance, seasonal reset, and inventory replacement. Downward drift is the structural default when the shelf isn't being restocked to weekly demand.
What it means for you
Your personal inflation rate depends on what you actually buy. A Slovenian household that spends heavily on the cleaning aisle, coffee, rice and meat saw a real 15%+ rise across their most-bought categories. A household shopping bread-milk-shampoo saw closer to 4–5%. The basket median of 9% describes an average house, not yours. If your grocery bill feels heavier than the official inflation number suggests, check the receipt — the cleaning aisle is usually where the money went.
Data source: Based on 8,168 Slovenian grocery SKUs paired across 57 level-2 categories with ≥30 paired SKUs each, comparing each SKU's median price in June–August 2025 against February–April 2026. Total underlying data: 253,855 Slovenian price records between 2025-05-28 and 2026-04-13. Data reflects real shelf prices as reported at time of purchase.
Products referenced in this story
Real shelf prices as reported by Sivix contributors. Tap any product to see current prices.